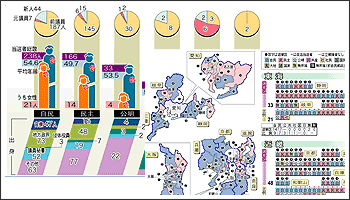
Graphical Chart

For minute-by-minute reports of the election returns, we made a plug-in for Adobe Illustrator which creates printable graphic charts automatically using the reports. The plug-in enabled a newspaper office to publish the result quickly and accurate.
completion: Apr.2008
Client: A major newspaper company
Customized plug-ins: TypeSet-Pro, etc.
